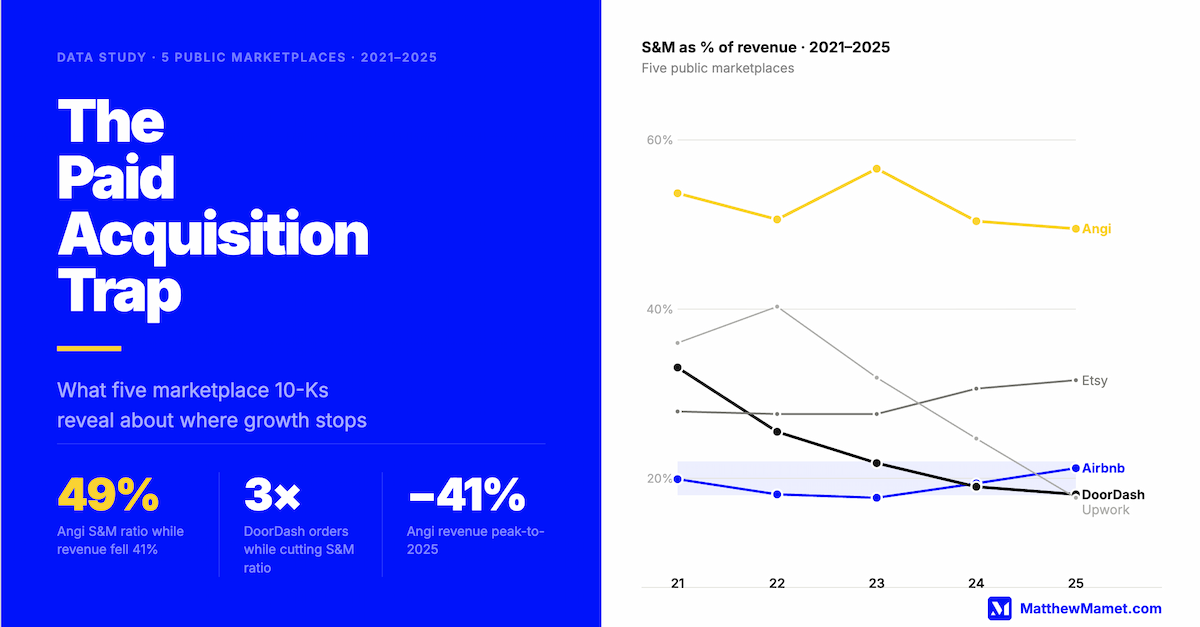
After years of arguing this point in rooms where the default answer was always more acquisition spend, I finally decided to do the math properly. I had argued it plenty - in planning cycles, in board prep, in post-mortems where the Marketing line kept growing and the growth rate kept shrinking. But I had always been arguing from pattern recognition and operational instinct. I wanted the numbers.
So, I spent the past week pulling five years of SEC 10-K filings for five public marketplace companies. The question was simple: does spending more on sales and marketing produce more growth? The answer, across 25 company-years of data, is no. In most cases, the correlation runs the other way.
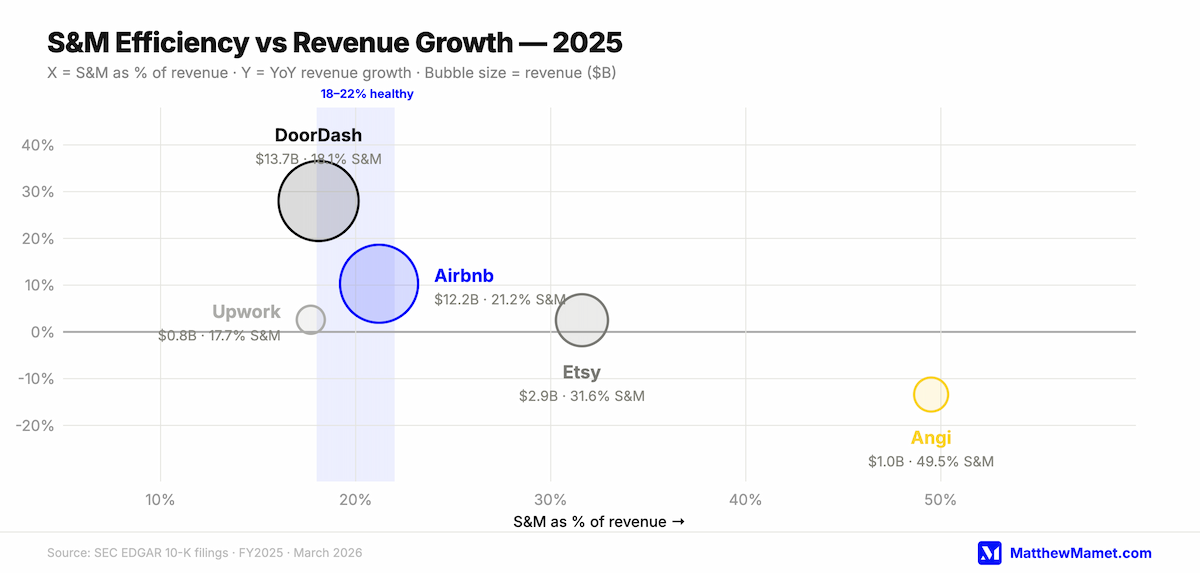
Angi has spent between 50% and 57% of its revenue on sales and marketing every year since 2021. Revenue peaked in 2022 and has declined every year since - down 41% from peak to 2025. Etsy increased its S&M spend every year for five years while growth decelerated from 10% annually to under 3%.
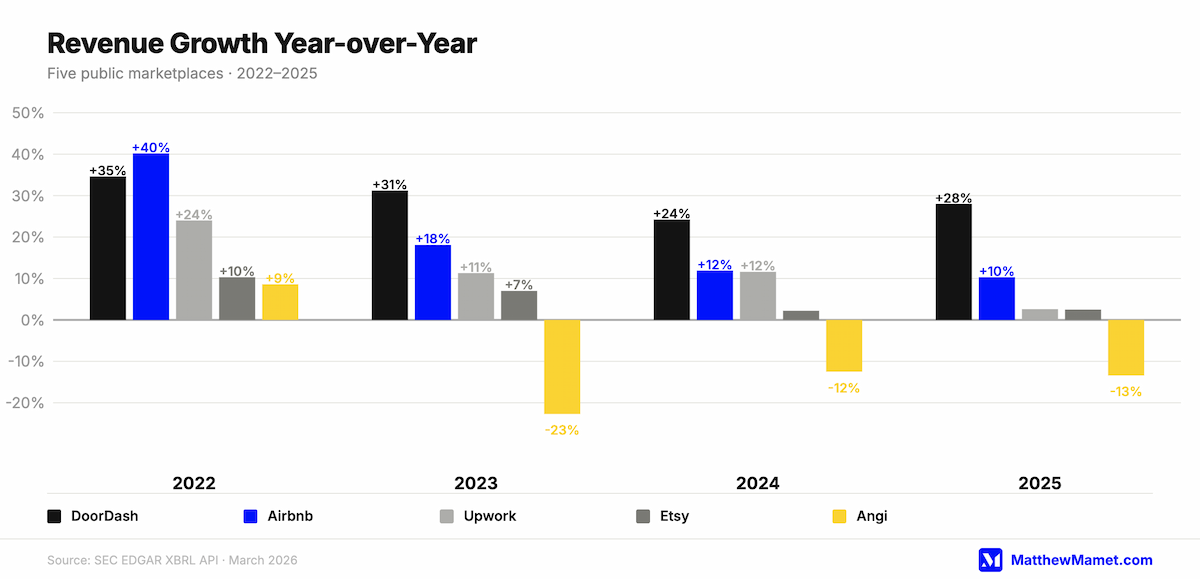
Meanwhile, DoorDash cut its S&M ratio from 33% to 18% over four years while tripling revenue and growing total orders from 816 million to 2.6 billion. Airbnb holds steady at 21% S&M and compounds at double-digit growth. Upwork cut from 40% to 18% and reached consistent profitability.
This is what the paid acquisition trap looks like in the data. And more importantly, this is what escaping it looks like.
A quick framing note before the data: I am not arguing that acquisition spending is bad. Every marketplace needs to acquire users. The question is what the acquisition budget is actually doing - growing the business, or subsidizing the leaky bucket underneath it.
The S&M Benchmark
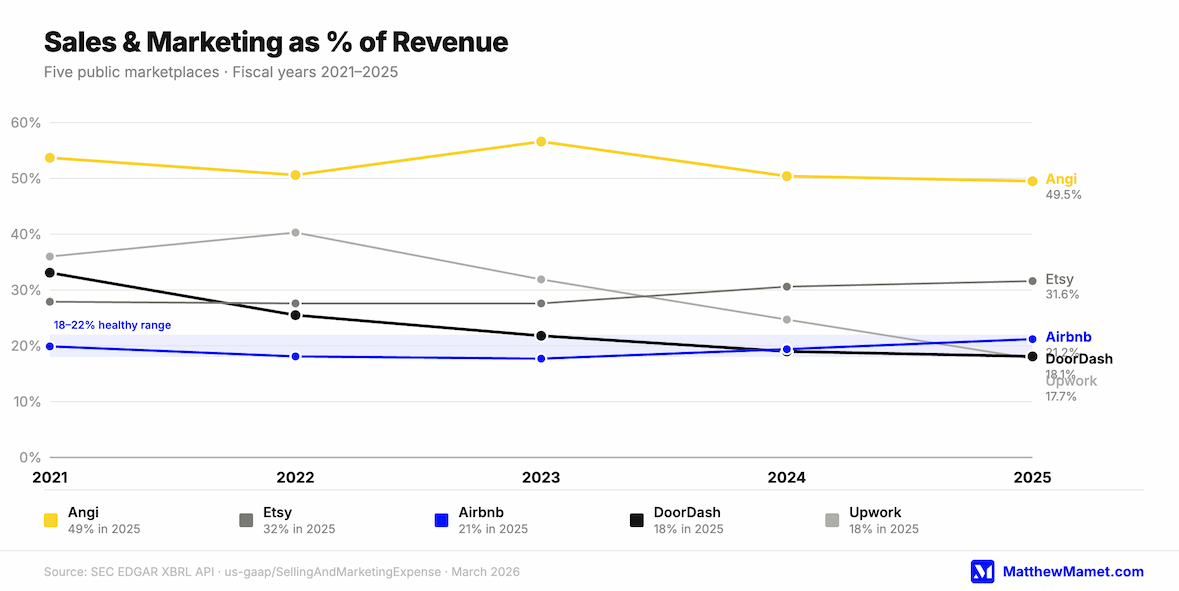
Across five public marketplaces over five years, sales and marketing as a percentage of revenue ranges from 17.7% (Upwork 2025) to 56.6% (Angi 2023). The pattern is not random.
The companies that aggressively cut their S&M ratio - DoorDash and Upwork - are profitable and growing. The companies that allowed it to rise or stay elevated are struggling. Airbnb, which held the ratio stable in the 18-21% range throughout, has compounded steadily. The data clusters in a way that suggests an operational range: marketplaces running at 18-22% of revenue on S&M tend to grow. Marketplaces running above that for sustained periods tend not to.
This is not a rule. It is a pattern. And the pattern is consistent enough across five different business models - food delivery, travel, e-commerce, home services, freelance labor - that it is worth taking seriously.
📊 The data suggests a healthy S&M range for a scaling marketplace is 18-22% of revenue. Operating above that for multiple years is not a growth strategy - it is a sign that retention is broken.
Angi: The Clearest Case
Angi is the most instructive data point in this study because the pattern is unambiguous and has now run for five consecutive years.
From 2021 to 2025, Angi spent between $510M and $890M per year on sales and marketing - consistently 50-57% of revenue. Over the same period, revenue peaked at $1.76B in 2022 and declined to $1.03B by 2025, a 41% reduction. Operating income was negative every year through 2024, turning slightly positive in 2025 only after Angi cut its S&M budget by 41% from peak.
The operational metric tells the same story. Monetized transactions declined every year: 31,510 thousand (2021) to 28,938 (2022) to 27,111 (2023) to 24,381 (2024). More spend. Fewer transactions. The platform was not building the kind of user behavior that generates return visits without paid re-acquisition. Every transaction was effectively a new customer.
This is the trap in its terminal form. When a marketplace cannot convert transactional users into repeat users, the acquisition budget is not building a business - it is renting one. The moment you reduce spend, revenue falls. The moment you maintain spend, margin disappears. There is no exit from this position without fixing the underlying retention problem.
📊 Angi spent $4.6B on sales and marketing from 2021 to 2025. Revenue declined 41% from peak.
DoorDash: The Escape
DoorDash's trajectory is the inverse of Angi's, and it is worth understanding precisely how the escape happened.
In 2021, DoorDash spent 33.1% of its $4.89B revenue - $1.62B - on S&M while losing $470M. By 2025, it spent 18.1% of its $13.72B revenue - $2.48B - on S&M while earning $940M. S&M spend grew by $860M in absolute dollars. But revenue grew by $8.83B. The ratio fell because revenue grew faster than acquisition spend - not because DoorDash cut the budget.
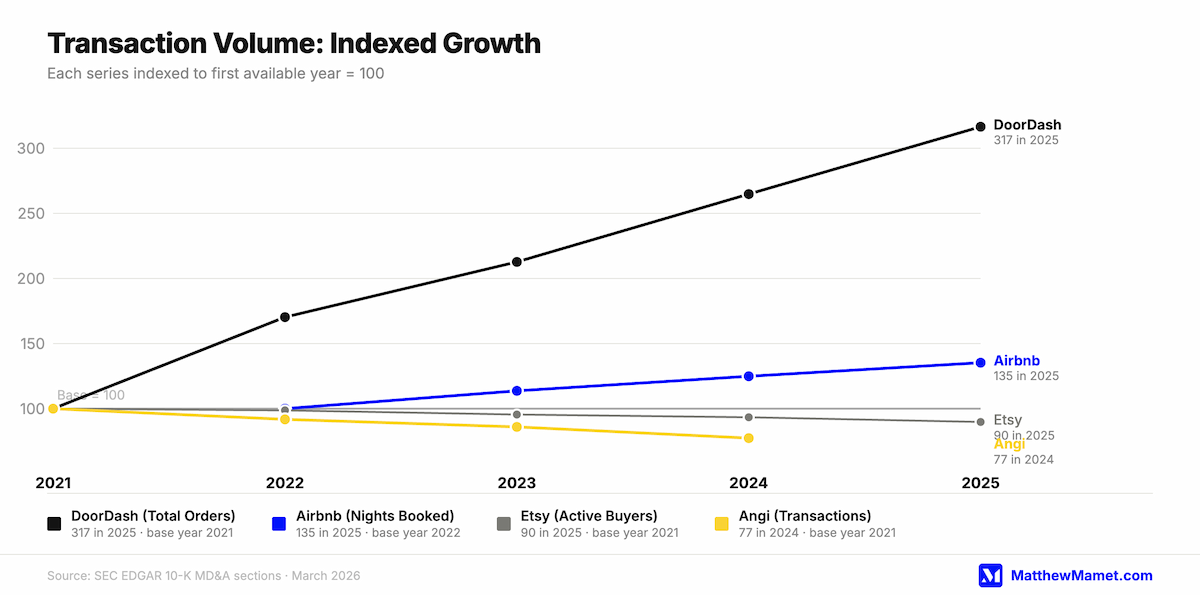
The mechanism was DashPass. By the end of 2025, DoorDash had over 35 million DashPass, Wolt+, and Deliveroo Plus subscription members across its platforms. A subscription member does not need to be re-acquired each time they want lunch. They generate revenue through habitual use at near-zero marginal acquisition cost. The product converted the economics from 'pay to acquire every order' to 'earn recurring revenue from retained users.'
This is the critical distinction. DoorDash did not solve its S&M problem by spending less on marketing. It solved it by building a product that made the acquisition spend more durable. Once a user converts to DashPass, the initial acquisition cost is amortized across dozens or hundreds of future orders, not just one.
📊 DoorDash cut its S&M ratio from 33% to 18% over four years. Total orders more than tripled, from 816M to 2.6B.
Total orders grew from 816 million (2021) to 2,583 million (2025) - more than tripling - while the cost of driving each incremental order fell sharply. That is the compounding effect that high-retention marketplaces produce and low-retention ones cannot.
Etsy: Stuck in the Middle
Etsy occupies the most instructive middle position in this study. It is not in crisis like Angi, but it is not compounding like Airbnb or DoorDash. It is stuck. And the data shows exactly why.
Active buyers have declined every year since the 2021 pandemic peak: 96.3M (2021) to 95.0M (2022) to 92.0M (2023) to 89.9M (2024) to 86.5M (2025). Etsy added 21.2 million new buyers in 2025. But it lost more than that through attrition. The acquisition engine is running, but it is filling a bucket that leaks faster than it fills.
The retention data from Etsy's own 10-K disclosures makes the underlying problem precise: habitual buyers - defined as those spending $200 or more across 6 or more purchase days per year - make up only 7% of Etsy's active buyer base but generate 40% of GMS. The business is overwhelmingly dependent on a small cohort of highly engaged buyers and a large base of occasional ones who are not converting to habitual use.
Etsy knows this. They have been disclosing the habitual buyer metric for years, which suggests they are tracking it internally. But S&M as a percentage of revenue has risen from 27.9% in 2021 to 31.6% in 2025 - moving in the wrong direction - while growth decelerated from 10% annually to under 3%. The pattern is: more acquisition spend, less growth. The trap is forming, though it has not yet reached the Angi outcome.
📊 Etsy's habitual buyers - 7% of its active base - generate 40% of its gross merchandise sales. The other 93% generate the remaining 60% and are not coming back reliably.
Airbnb: The Benchmark
Airbnb is the clearest example of what a well-functioning marketplace acquisition model looks like over time.
S&M has held in the 18-21% range for five consecutive years. Revenue compounded at double-digit rates across most of the period. Net income was $2.51B in 2025. That is not an accident of category or COVID tailwinds - it is the direct result of building a product where most users come back without being asked. The business is structurally sound in a way that Angi and Etsy are not, and the retention data from Airbnb's S-1 filing shows why.
In 2019, before the pandemic distorted the numbers, 69% of Airbnb's revenue came from repeat guests - up from 62% in 2017 and 66% in 2018. Host retention was similarly strong, with cohort data showing approximately 90% retention in year 2 and 88% in year 3. When 69% of your revenue comes from users who already know you, the acquisition budget is doing something fundamentally different than it does at Angi. It is growing the top of the funnel, not replacing the bottom.
The result is a business where S&M expense stays roughly proportional to revenue as both scale. There is no spiral. The ratio does not require heroic acquisition spend to maintain because the existing user base generates most of the revenue on its own.
Upwork: The Turnaround
Upwork's trajectory mirrors DoorDash's in structure, even though the product and market are completely different.
S&M peaked at 40.3% of revenue in 2022 while the company lost $90M. By 2025, S&M was 17.7% of revenue and net income was $120M. The turnaround happened because Upwork built a platform that retained clients over time without requiring re-acquisition. Upwork's S-1 disclosed that by mid-2018, approximately 50% of client spend came from clients who had used the platform for more than three years. Client cohorts maintained approximately 70% of their first-quarter spend through their fourth quarter and beyond.
This is what platform stickiness produces. When a client has built a roster of trusted freelancers on Upwork, leaving the platform has a real cost. They would need to rebuild those relationships somewhere else. That switching cost is retention infrastructure - and it is worth far more than any re-acquisition campaign.
Active clients peaked at 872K in 2023 and have declined slightly since, at 843K in 2025. But gross services volume per active client has risen, meaning the clients Upwork retains are spending more over time. Revenue per user is increasing while S&M as a percentage of revenue falls naturally. That is the compounding dynamic working as it should.
What the Data Actually Says
The pattern across all five companies points to the same underlying mechanism. High S&M% is not a cause of low growth in a mechanistic sense - both are downstream of the same problem: weak retention. The marketplace is paying to replace users it should be keeping. The acquisition budget is subsidizing a retention problem that the product has not solved.
When those mechanisms are in place, the S&M ratio falls as a natural consequence of growth. When they are not, the ratio stays elevated or rises no matter how much you spend.
The companies in this study that are struggling are not failing because they are bad at marketing. Angi and Etsy are sophisticated businesses with experienced teams. They are struggling because the product has not built the behavioral patterns that make users come back without being re-acquired. That is a product problem. The marketing budget is just where it shows up on the income statement.
High S&M% is not a marketing problem. It is a retention problem wearing acquisition's clothes.
The Diagnostic
Here is the test. Pull your S&M as a percentage of revenue for the last three years. If it has been rising while growth has been flat or decelerating, you are in the trap. Not approaching it. In it. The question is not whether to cut the marketing budget - cutting spend without fixing retention just accelerates the revenue decline. The question is what the product is doing to build habitual use.
The question is not whether to cut the marketing budget - cutting spend without fixing retention just accelerates the revenue decline. The question is what the product is doing to build habitual use.
Three questions worth answering before your next planning cycle. What percentage of your revenue comes from users who were also active in the prior year? If it is below 60%, acquisition is subsidizing a retention problem. Do you have a cohort of highly engaged users generating a disproportionate share of revenue - and if so, what is the product path to growing that cohort rather than just acquiring more occasional users? And what is the specific mechanism by which a new user becomes a habitual one? If you cannot name it, it does not exist.
DashPass is the right mental model: find the product or feature that converts a transactional user into a member. Build habitual use. Lower the marginal cost of generating repeat revenue. When that works, the S&M ratio falls on its own - and the budget you were spending to replace lost users can go toward genuinely growing the base.
Methodology and Data Sources
All financial data was pulled directly from the SEC EDGAR XBRL API. Operational metrics extracted from 10-K annual filings MD&A sections. Cohort and retention data sourced from S-1 registration statements (Airbnb 2020, DoorDash 2021, Upwork 2018). All data is publicly available.
Companies analyzed: Airbnb (ABNB), Etsy (ETSY), DoorDash (DASH), Upwork (UPWK), Angi Inc. (ANGI). Fiscal years 2021-2025, all calendar year-end December 31.
This is a correlation analysis. High S&M% does not mechanistically cause low growth - both are downstream of weak retention. The study identifies the pattern; it does not assign causation.